
Aetheris 1.2.0: faster resource tables and fixed metrics
Aetheris 1.2.0 is out with a focused set of changes around the resource browser: the object table is much faster, CPU and memory metrics are more useful, and the app now does less work when Kubernetes sends a burst of watch updates.
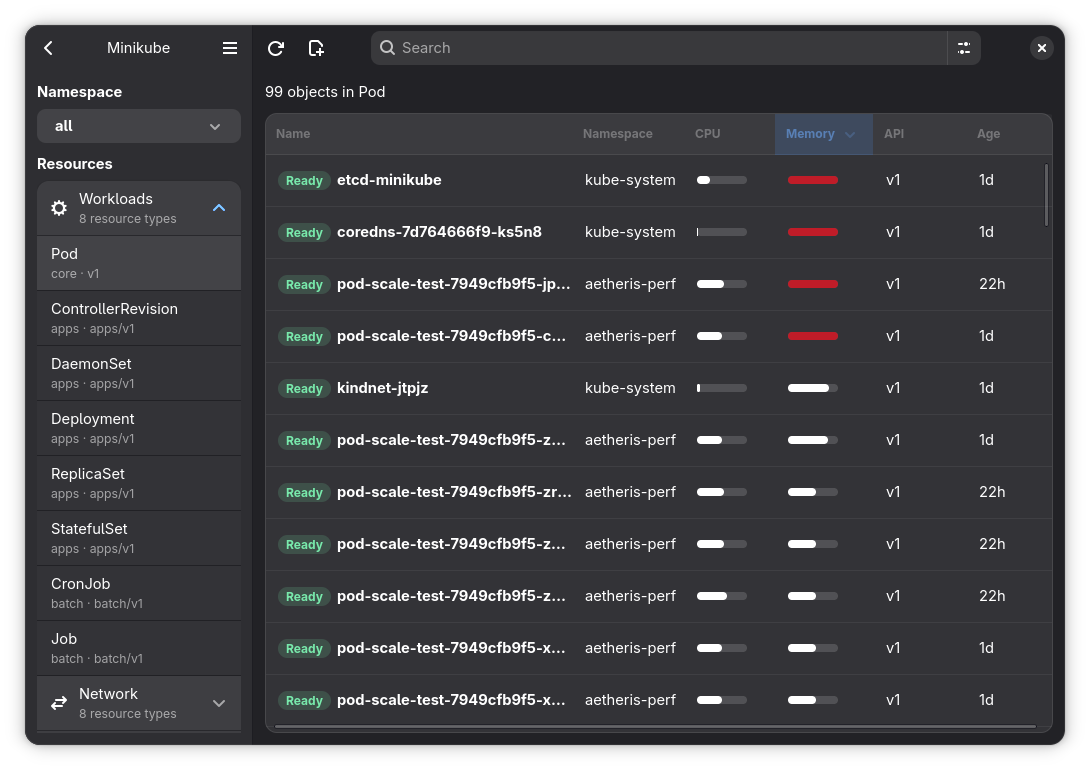
The headline change is the resource table. In previous versions, Aetheris used
a GtkListBox-based table for Kubernetes objects. That worked for small
namespaces, but it did not scale well once a cluster had thousands of Pods,
Deployments, Services or other resources. The UI had to build and maintain too
many row widgets, and that cost was visible while loading, filtering, resizing
columns, or receiving live updates.
In 1.2.0, that table now uses GtkColumnView. The difference is not just the
new column widget: GtkColumnView virtualizes rows when it is wired directly
into the scroll view, so Aetheris only realizes the rows that are actually on
screen. The backing model can be replaced in one operation, sorting happens at
the model layer, and column resizing uses GTK’s native column machinery instead
of custom row-by-row layout updates.
That removes a lot of unnecessary work from the main loop. In testing, the
GtkColumnView version handled more than 10,000 Pods without the interface
stuttering, while scrolling, filtering and column work stayed responsive. Live
watch updates also no longer force the whole visible table to churn for every
event. Aetheris coalesces object refreshes during bursts, so many rapid
Kubernetes events turn into one table refresh instead of a long sequence of
repaints.
Metrics that match Kubernetes
This release also fixes and improves the metrics path.
The important bug was in Pod metrics. Kubernetes exposes Node metrics with a
top-level usage field, but Pod metrics report usage per container under
containers[]. Aetheris now handles both shapes: Nodes read the top-level
usage, while Pods sum the container samples, matching how tools like kubectl top pods present Pod totals.
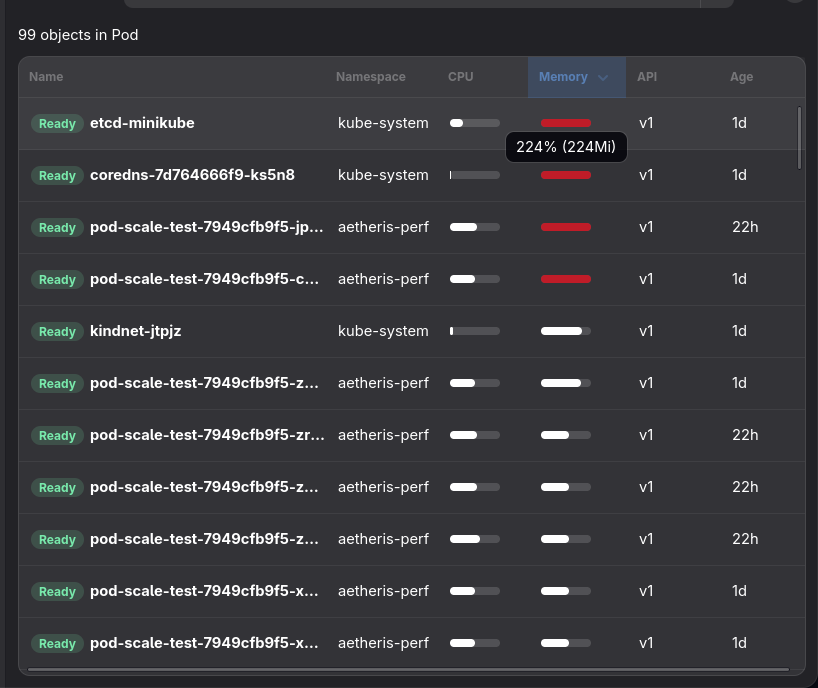
Aetheris also parses Kubernetes quantity suffixes more carefully, including CPU
units such as n, u and m, and memory units such as Ki, Mi and Gi.
That lets the app calculate CPU and memory ratios instead of only showing raw
values.
For Pods, those ratios compare current usage against the Pod’s resource requests when requests are available. For Nodes, they compare usage against allocatable CPU and memory. The resource table uses that information for compact CPU and memory bars, while the detail view can still show the raw values for a more exact read.
Metrics now refresh during object watches as well. When Aetheris is watching Pods or Nodes, it periodically reloads the metrics samples and rebuilds the summaries without requiring the user to leave and reopen the resource.
Smaller polish
The 1.2.0 release also updates the app metadata, search keywords and screenshots, plus a few contribution docs around the project. It is a small release on paper, but it changes a core part of the day-to-day experience: opening a busy cluster and getting useful signal quickly.
If you tried Aetheris before and hit slow resource lists or missing Pod metrics, this is the release to try again.